Summary
While MACPA puts out a Medicaid and CHIP data book each year, this one is especially important because it is the first one to use the T-MSIS data. If you watch Macpac.gov throughout the year, you will have seen much of the components of this compilation.
What’s in it
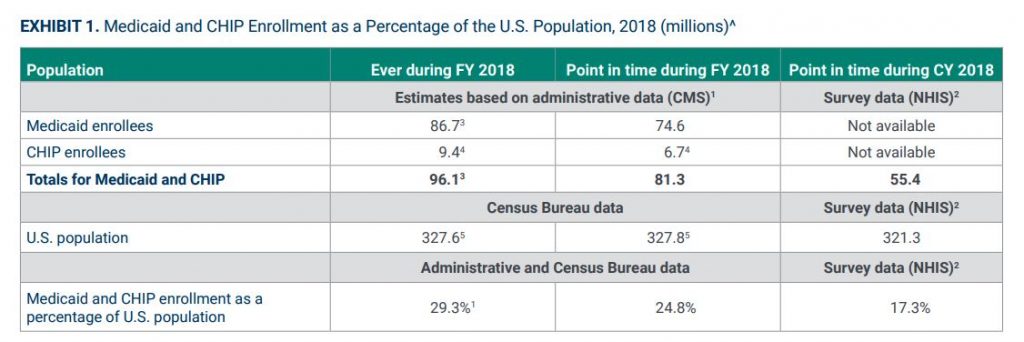
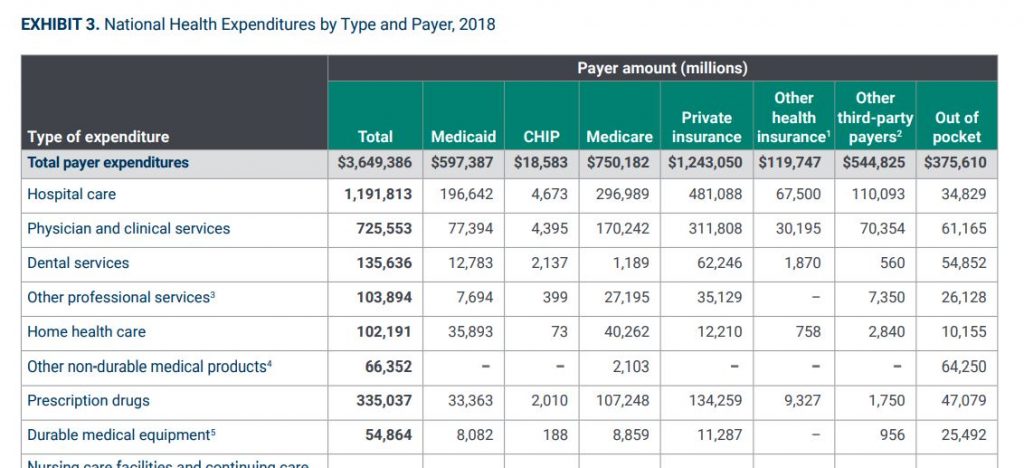
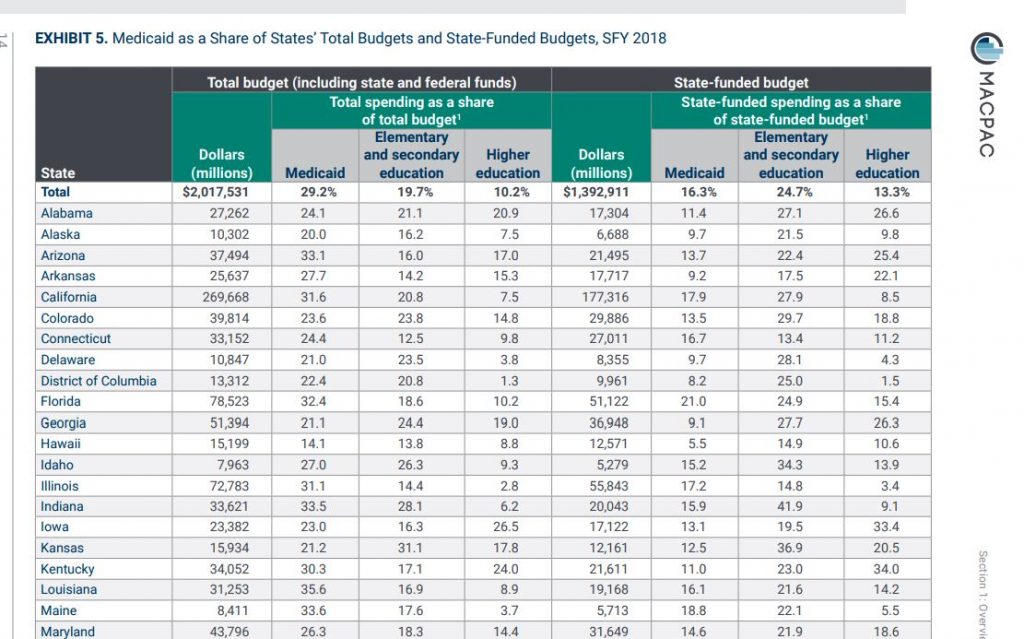
166 pages of charts and key statistics about all aspects of the Medicaid and CHIP programs, including data on:
- Enrollment (including demographics trends)
- Spending (health services and administrative)
- Eligibility levels by state
- Utilization
A detailed explanation of methodology used by the research team, including specifics on:
- The use of the T-MSIS data
- Adjustments for spending data
- A section on understanding managed care enrollment and spending data
Data sources included
National Health Interview Survey (NHIS)
The National Health Interview Survey (NHIS) has monitored the health of the nation since 1957. NHIS data on a broad range of health topics are collected through personal household interviews. Survey results have been instrumental in providing data to track health status, health care access, and progress toward achieving national health objectives.
The Medical Expenditure Panel Survey (MEPS)
The Medical Expenditure Panel Survey (MEPS) is a set of large-scale surveys of families and individuals, their medical providers, and employers across the United States. MEPS is the most complete source of data on the cost and use of health care and health insurance coverage.
Transformed Medicaid Statistical Information System (T-MSIS)
The T-MSIS data set contains:
- Enhanced information about beneficiary eligibility
- Beneficiary and provider enrollment
- Service utilization
- Claims and managed care data
- Expenditure data for Medicaid and CHIP
Key implications of this data set
The trends section allows for some macro observations:
- The percent of Aged, blind or disabled members of the program was 28% in 1975. In 2018 it was 18%- giving credibility to the argument that the Medicaid program has experienced significant mission drift over the past 40 years or so.
- The financial burden of Medicaid on states has doubled in the past twenty years, despite unprecedented levels of federal funding under the Affordable Care Act enhanced reimbursement for Medicaid expansion. In 1992, states spent 10% of their own money on Medicaid (as a percent of their entire state budget). In other words, 1 out of every 10 state dollars went to Medicaid. In 2018, it was 20%. Meaning 1 out of every 5 state dollars now must be spent on Medicaid.
- While trending data is not provided, it is interesting to see the percentages of Medicaid funds spent by benefit type. In descending order:
- Fee for service / direct payments
- Facilities – 22.5%
- Hospitals (13%)
- LTSS (“nursing homes”)- Institutional (9.5%)
- Clinics and health centers (2%)
- Providers – 14%
- Physicians (1.3%)
- Dentists (0.007%)
- Other practitioners (0.003%)
- LTSS- Home and Community Based (13%)
- Other acute services (7%)
- Drugs (0.008%)
- Facilities – 22.5%
- Managed Care – 50%
- Medicare Premiums – 3%
- Fee for service / direct payments


